GSoC 2026: Introduction and Project Timeline
Welcome to my Google Summer of Code 2026 blog! Over the next few months, I’ll be documenting my journey and progress while working with GNU Octave as part of GSoC 2026. Through these posts, I plan to share the work I’m doing, the ideas and design decisions behind the project, the challenges I run into during development, and the things I learn along the way.
I wanted this blog to be more than just weekly status updates. My goal is to make it a place where I can properly track the evolution of the project and also give some insight into what contributing to a large open-source scientific computing project actually looks like from a student contributor’s perspective.
Before getting into the technical details, a quick introduction about myself - I’m Avanish Salunke, a third-year B.Tech student at VJTI, Mumbai, currently pursuing a minor in Cybersecurity. I’ve always enjoyed areas where mathematics and programming come together, which is one of the reasons I became interested in statistical computing and open-source development.
This summer, I’ll be working on improving GNU Octave’s statistics package by adding LinearModel and CompactLinearModel objects. I’m really looking forward to contributing to software that is widely used by students, researchers, and engineers, while also learning a lot throughout the process.
What is GNU Octave?
GNU Octave is a high-level programming language designed for scientific computing and numerical analysis. It is widely used for solving mathematical problems, performing matrix computations, data analysis, and running numerical experiments.
One of Octave’s major strengths is its high compatibility with MATLAB, allowing many MATLAB programs to run with minimal changes. Because of this, it is commonly used by students, researchers, and engineers as a free and open-source alternative to MATLAB.
Octave is part of the GNU Project and is released under the GNU General Public License (GPL), making it freely available for anyone to use, modify, and contribute to. Over the years, it has grown into a powerful platform for scientific and statistical computing across academia and research.
My GSoC 2026 Project
My project this summer will focus on bringing a upgrade to the GNU Octave statistics package as part of Google Summer of Code 2026. Specifically, I’ll be building out the LinearModel and CompactLinearModel classes, along with the core functions that power them, like fitlm and stepwiselm. The main goal is to give users a modern, and MATLAB-compatible way to fit, analyze, and deploy statistical models.
What is Linear Regression?
If you’re reading this and thinking, “Okay, but what exactly is a linear model doing?” - don’t worry, the core idea is highly intuitive.
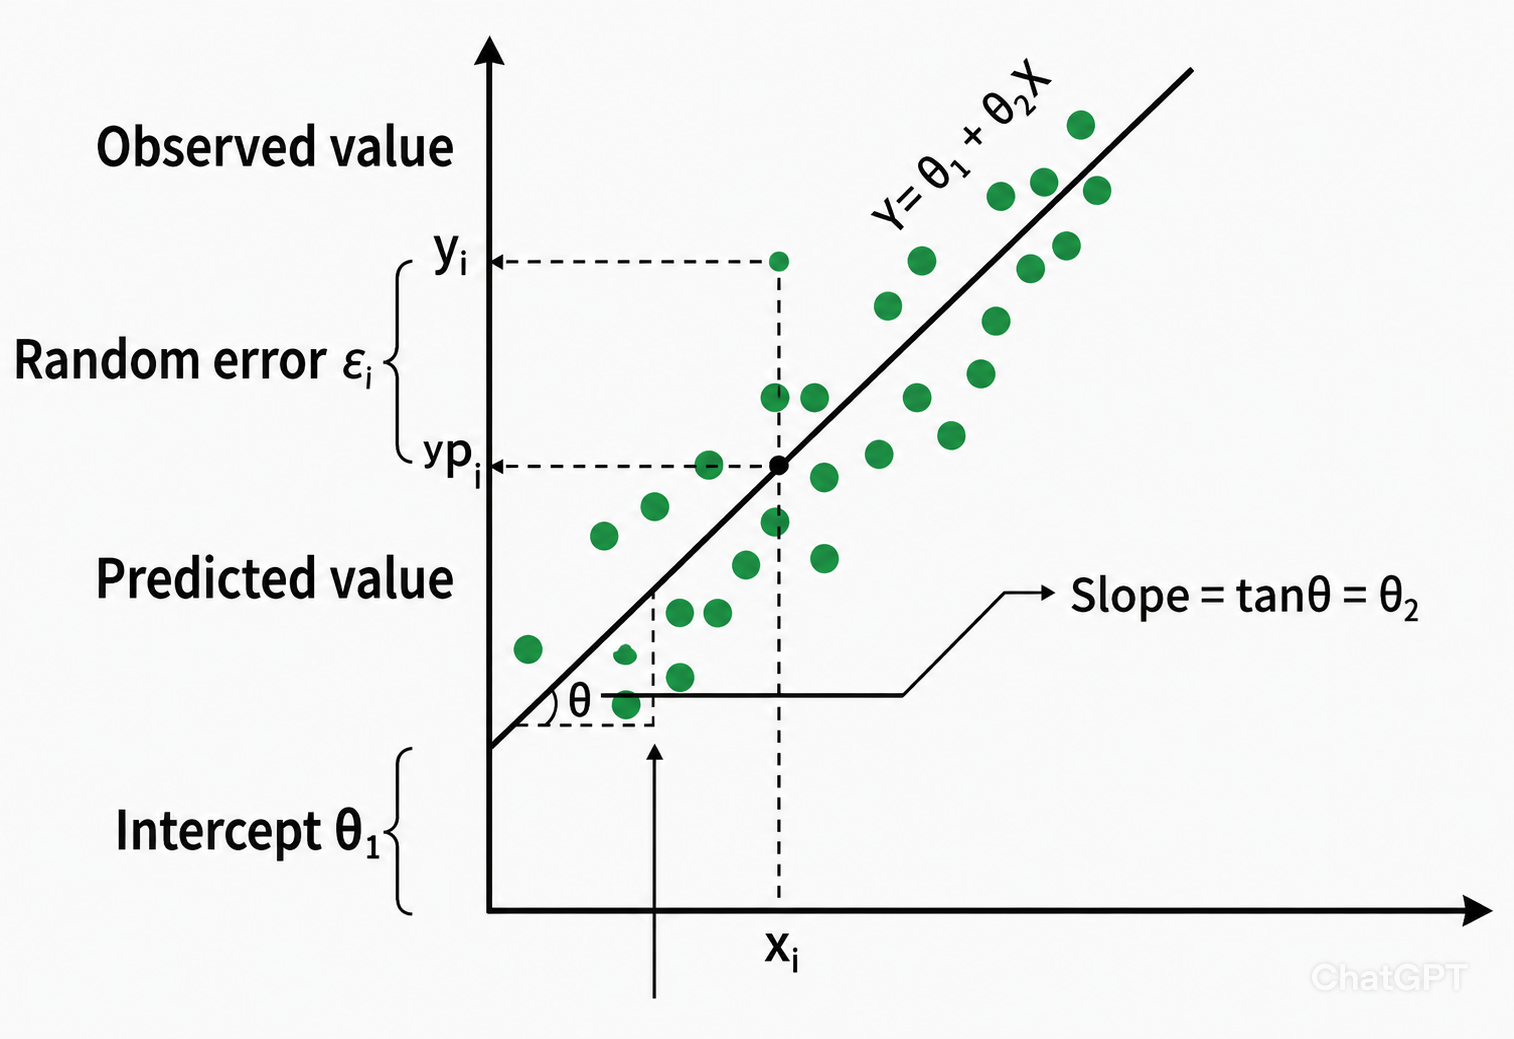
Imagine you are trying to figure out the connection between two things, like the square footage of a house and its price. If you take a hundred houses and plot them on a graph - with size on the bottom and price on the side - you’ll end up with a messy, upward-sloping cloud of dots.
Linear regression is essentially the math of drawing the “line of best fit” straight through the middle of that cloud. The algorithm calculates the exact angle and position of a straight line so that it sits as close to every single dot as mathematically possible.
Why do we care about this line?
Predicting the unknown! Once you have that perfect line, you can use it to make incredibly educated guesses. If a brand new house hits the market and you know its square footage, you just find that size on your graph, trace it up to your line, and you instantly have a accurate price prediction.
Why this project matters?
In the real world, data is rarely just two simple variables. You might be predicting house prices based on size, age, number of bedrooms, and the local ratings all at once. The math gets complex, and drawing a simple line isn’t enough. You have to ask yourself: Is this prediction actually accurate? Which of these variables are completely useless? Are there weird outlier houses messing up the math?
That is exactly why returning a rich, data-packed LinearModel object instead of just a raw equation is so important. It gives you the predictive line, but it also gives you all the diagnostic tools to prove whether that line is actually trustworthy.
What exactly is a LinearModel?
If you’ve ever run a basic regression in a script, you know that you usually just get a raw array of numbers back. It works, but it’s pretty basic. A LinearModel object changes that completely. Instead of just returning a math equation, it acts like a massive, all-in-one container. It holds your original training data, the error margins (residuals), hypothesis tests, and a ton of diagnostic checks. So, instead of writing a bunch of separate scripts to figure out if your model is accurate or if outliers are ruining your data, you just query this single object to get all your answers.
How do we actually build it? (Upgrading fitlm and introducing stepwiselm)
To make these objects a reality, I’m working on two main functions. The first is a major update to Octave’s existing fitlm function. Right now, fitlm gives back basic arrays and structures. I am completely updating how it works on the inside. You will still hand it your dataset and a formula, but behind the scenes, it will use a brand new mathematical engine to handle missing values and text categories. Once it processes everything, it builds and returns your new LinearModel object.
The second function I am adding is stepwiselm, which acts kind of like an automated statistical assistant. If you have a massive dataset and aren’t sure which variables actually matter, stepwiselm tests adding and dropping different variables step-by-step until it finds the best model for you.
Why do we need a CompactLinearModel?
Because a standard LinearModel carries your entire dataset and all those heavy diagnostic tables around, it takes up a lot of memory. That’s perfectly fine when you are actively exploring data, but it’s not ideal if you just want to save the model to your computer or use it later to predict new things. That’s where the CompactLinearModel comes in. It removes all the heavy historical data and keeps only the bare minimum math needed to make predictions. It’s the lightweight, deployable version of the model.
Project Timeline
1. Midterm Evaluation (Target: Early July)
Goal: The Heavy Lifting and the Main Object
For the first half of the summer, my main goal is to build the core foundation of the project. I will be building the main LinearModel Class and upgrading the function that creates it.
What I will actually be doing:
- Building the Core Math Engines: I’ll be writing the private math functions that actually calculate the line of best fit, measure the error margins, and flag outlier data points.
- Upgrading
fitlm: I will be completely changing Octave’s existingfitlmfunction. I’ll be updating it to process messy, real-world data before securely passing that data to the new math engines. - Creating the
LinearModelClass: I will write the code that takes all those raw math results and bundles them together. This turns a simple list of numbers into an all-in-oneLinearModelobject that holds the original data, the final equation, and the full diagnostic tables. - Adding Essential Tools and Plots: I will write the code for the most common daily tasks: making predictions, testing data, and building the core plotting methods. This ensures users can instantly generate graphs (like residual and diagnostic plots) to visually check if their model is actually accurate.
2. Final Evaluation (Target: Mid-August)
Goal: With the heavy math and the main object out of the way, the second half of my summer is about making sure these tools are fast, automated, and easy to use.
What I will actually be doing:
- Building the
CompactLinearModel: This is the lightweight version of the model. I’ll write the code that strips out all the bulky historical data, leaving only the bare minimum needed to make fast predictions. - Automating the Search (
stepwiselm): I will build a function that automatically tests hundreds of different variable combinations step-by-step to find the absolute best model for a dataset, so the user doesn’t have to guess. - Saving and Loading: I’ll add the code that lets users save their stripped-down models directly to their hard drive and load them back up in future sessions.
- Advanced Visuals: I’ll finish up the remaining plotting tools so users can generate charts to see exactly how different variables interact with each other.
I will dive into the detailed design decisions and implementation of the LinearModel class!
I am incredibly excited to get these tools into the hands of the Octave community. I’ll be posting updates here as I hit my milestones, so stay tuned!